Trade asymmetric.
Entry, stop, target → R:R ratio and the win rate you need to break even.
Trade this for real? Sutekka turns it into this →
Auto-pulled from your broker, rendered as a card you can drop into Discord, X, or your group chat. Free forever — no card.
Try the journal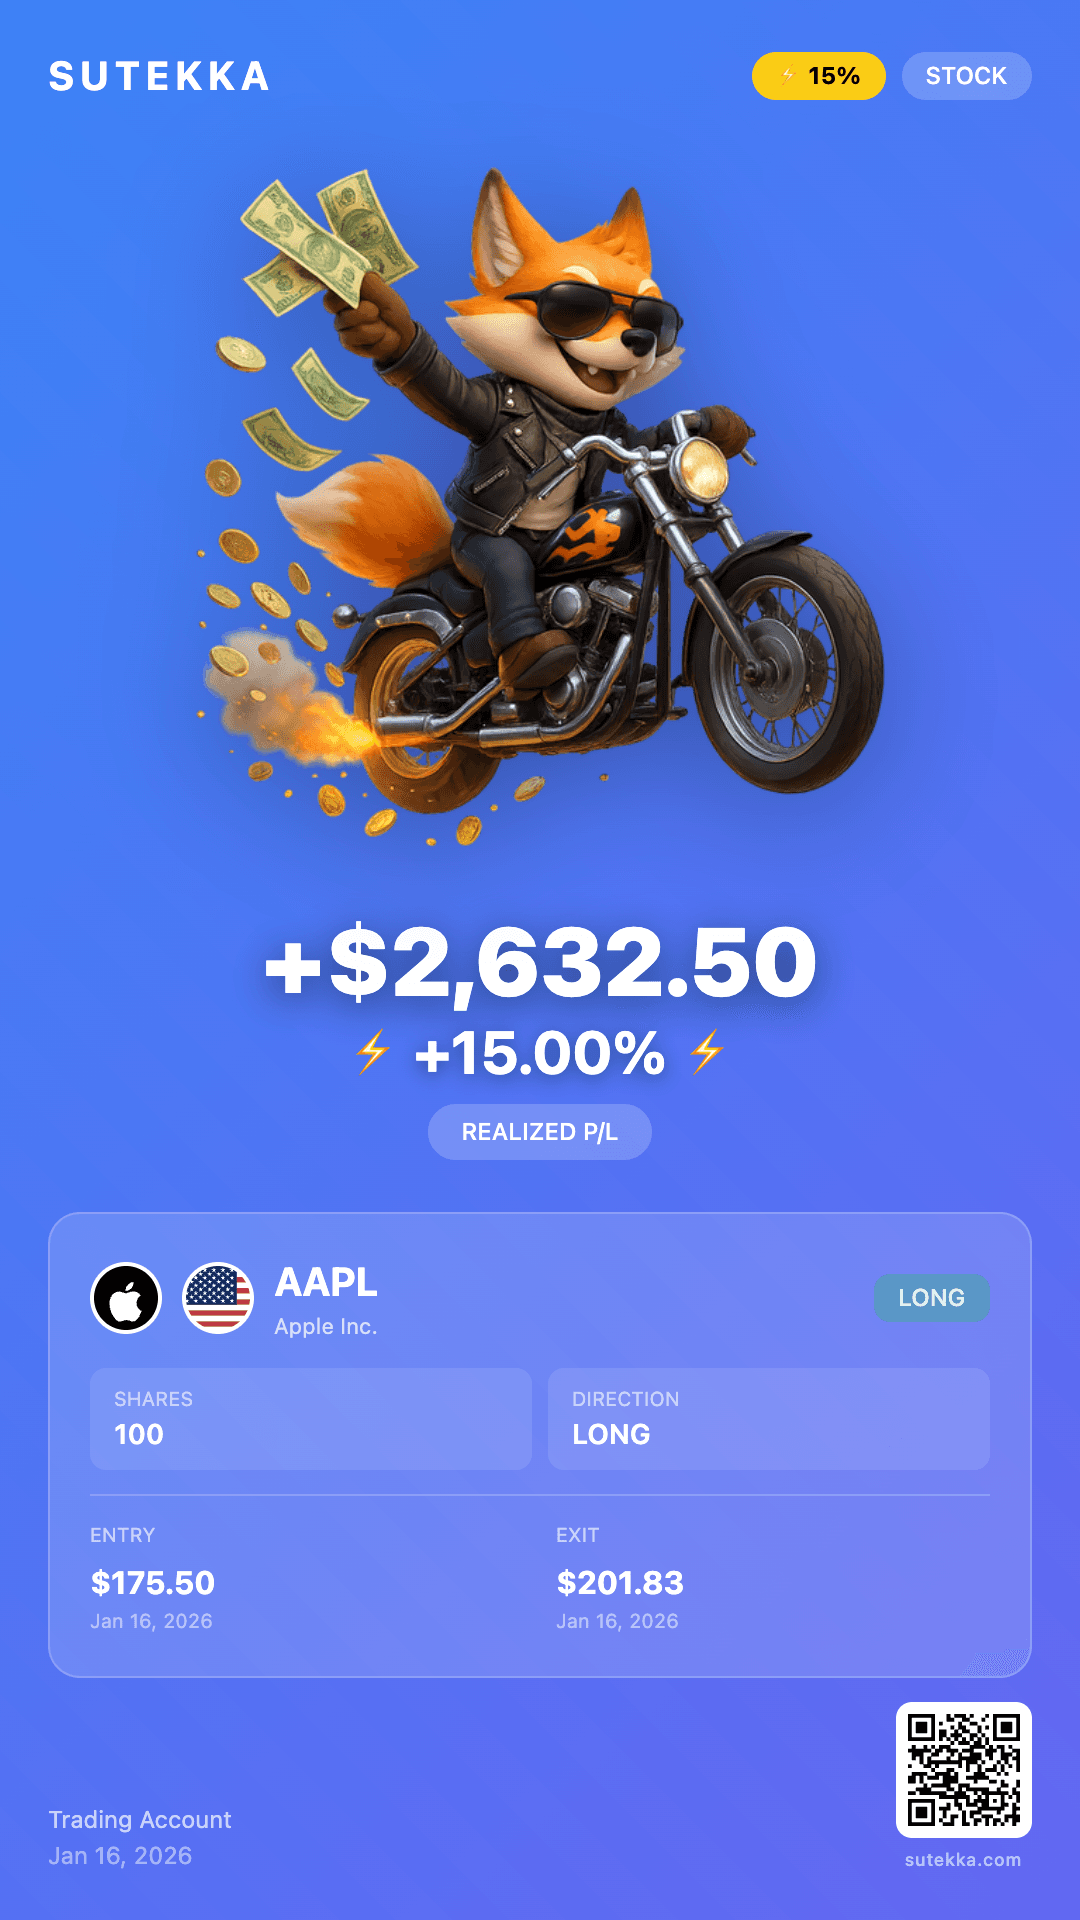
ALSO USEFUL
HOW IT WORKS
How risk:reward and breakeven win rate relate
R:R compares two distances measured from the same entry: entry to stop, and entry to target. The ratio alone says nothing about whether a trade is good — it only becomes meaningful when paired with how often you are right. That pairing is what the breakeven win rate expresses.
The relationship is breakeven = 1 ÷ (1 + R:R). At 1:1 you need to win half the time simply to stand still. At 1:3 you need only 25%. Every increase in reward relative to risk lowers the bar your accuracy has to clear, which is why R:R is the cheaper of the two variables to improve.
A worked example
Entry at $100, stop at $97, target at $109. Risk is $3 per share, reward is $9, giving 1:3. The breakeven win rate is 1 ÷ (1 + 3) = 25%.
So this setup can be wrong three times out of four and still not lose money. Win 35% of the time and it is comfortably profitable. Compare that to a 1:1 setup, which needs better than a coin flip forever — a much more fragile thing to build a strategy on.
Where this calculator misleads you
The ratio is planned, not realised. It assumes both the stop and the target fill exactly, and in practice stops slip while targets sometimes go unfilled by a few cents before reversing. Realised R:R is reliably worse than planned R:R, so a setup that pencils out at exactly breakeven is a losing one.
It also says nothing about probability. A 1:10 trade is trivial to construct — put the target far enough away and the ratio looks spectacular — but the odds of touching it may be near zero. Ratio and hit rate move against each other, and the calculator only shows one side of that trade-off.
The breakeven figure ignores costs entirely. Commissions, spread, and financing all raise the win rate you actually need. On small accounts or short holds, that gap between theoretical and effective breakeven is not a rounding error.
Terms on this page
FAQ
What is a "good" risk:reward ratio?
How is breakeven win rate calculated?
Should I avoid trades with poor R:R?
Done with the math?
Now log the trade.
Sutekka is the journal that tracks every trade you take. Free forever — no card.
Start logging — free