Track your trades in Rs.
How many Rs (units of initial risk) a closed trade actually made or lost.
INPUTS
$
$
Where you cut the loss. Defines 1R.
$
Where you actually closed.
For the dollar P&L row.
TRY ONE
RESULT
R-multiple+2.40R
DirectionLONG
1R (risk per share)+$5.00
Move per share+$12.00
Dollar P&L+$1,200.00
Dollar risk (1R total)+$500.00
POSTABLE ARTIFACT
Trade this for real? Sutekka turns it into this →
Auto-pulled from your broker, rendered as a card you can drop into Discord, X, or your group chat. Free forever — no card.
Try the journal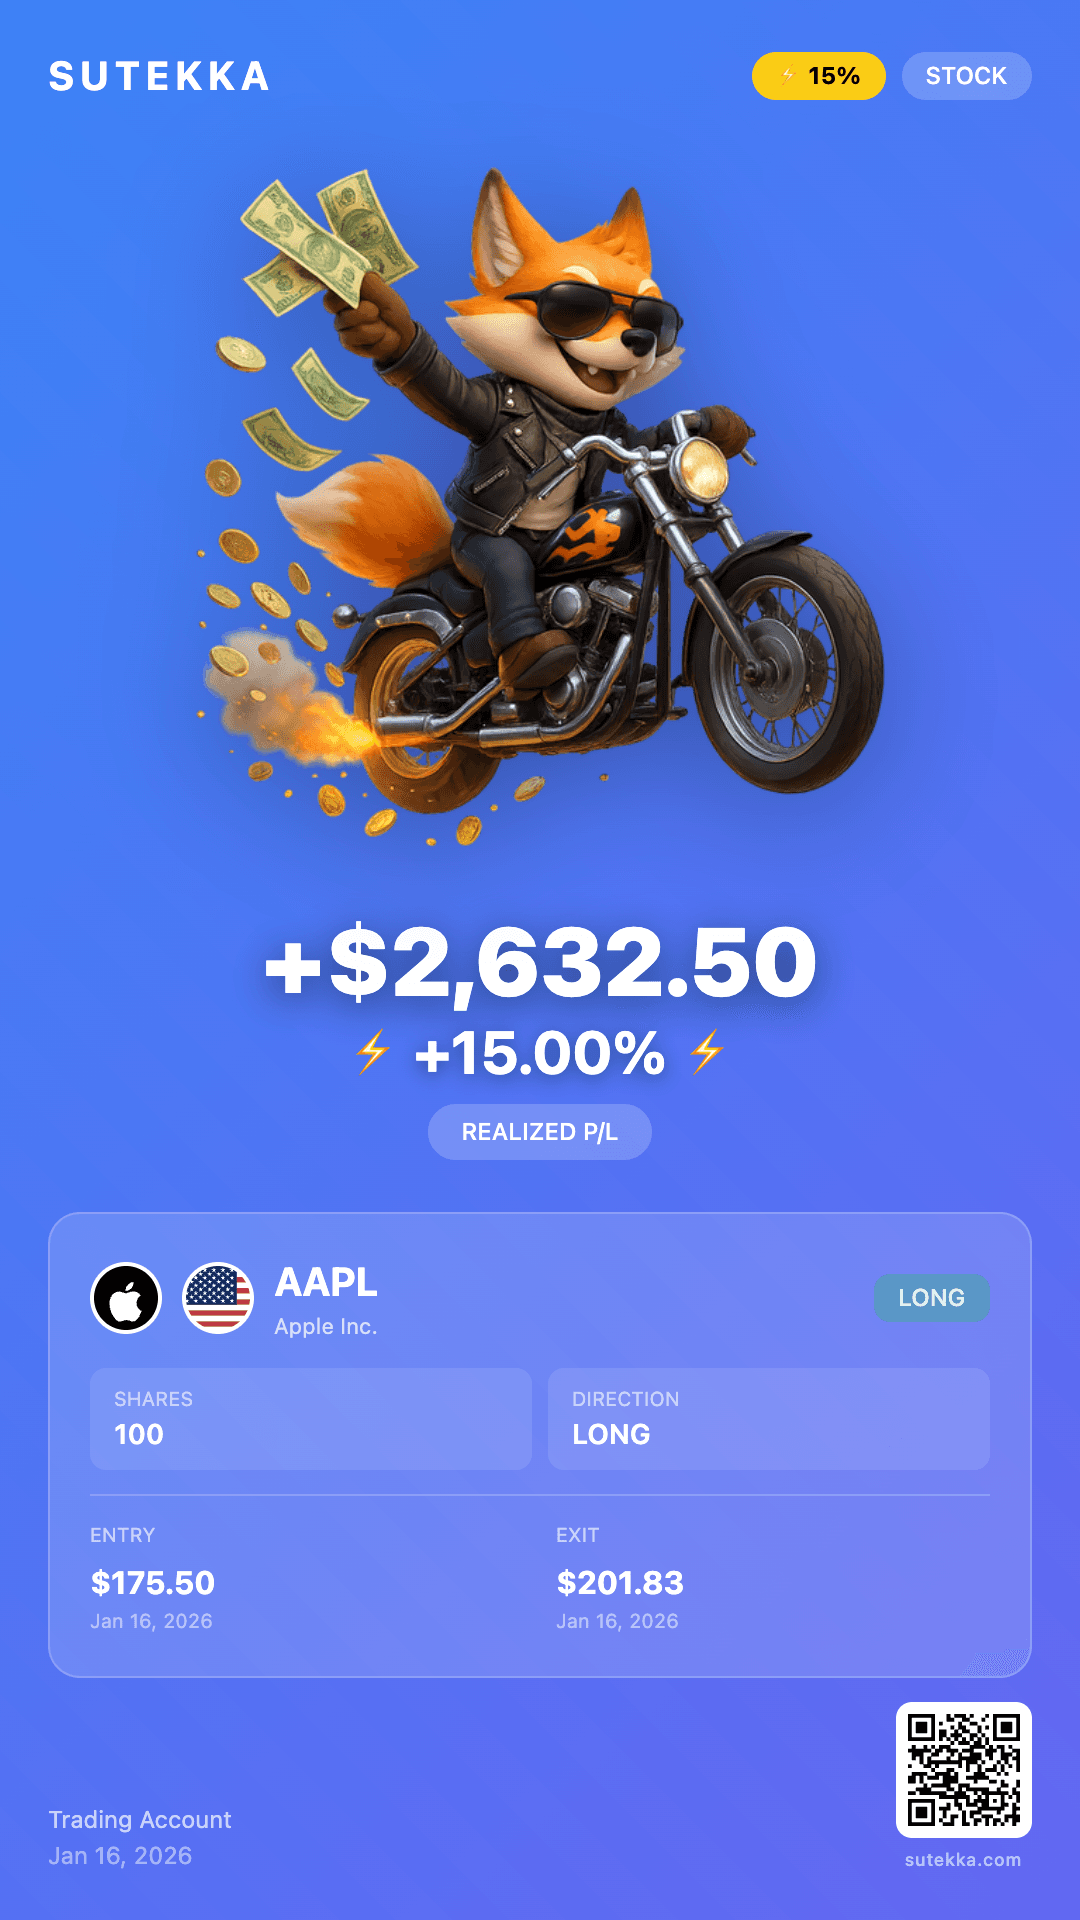
ALSO USEFUL
HOW IT WORKS
R is the unit of risk — your distance from entry to stop. A trade that returns 2R doubled your initial risk; a −1R is a clean stop-out. Trading in Rs decouples your performance from position size: 50 trades that average +0.4R is the same edge whether you risk $50 or $5,000 per trade. Most consistently profitable systems live between +0.2R and +0.5R average over hundreds of trades. Anything above +1R is either exceptional or unsustainable.
FAQ
What is an R-multiple?
The trade's realized move divided by the initial risk (1R = entry − stop). A trade that closed for +2R doubled what you were risking; a −1R is a clean stop-out.
Why use R instead of dollars?
R normalizes across position sizes. 50 trades averaging +0.4R is the same edge whether you risked $50 or $5,000 per trade — comparing in dollars would obscure that.
What's a "good" average R-multiple?
Sustained averages between +0.2R and +0.5R are professional. Anything north of +1R is either exceptional or unsustainable — the trade with the biggest R you ever take is more variance than skill.
NEXT
Done with the math?
Now log the trade.
Sutekka is the journal that tracks every trade you take. Free forever — no card.
Start logging — free