Sutekka Tools
CALCULATORS·MARKETS

Same index, in three currencies.

Convert prices and contract value between the three S&P 500 instruments. SPY-to-SPX ratio is editable to account for dividend + expense-ratio drift.

INPUTS
Fetching delayed quotes…
ENTER ONE
Cash S&P 500 index level (e.g. 5,000.00).
Defaults to 0.10. The actual ratio drifts down over the year from dividends + the ETF's expense ratio — adjust to whatever your broker is currently quoting.
How many ES contracts to size total exposure for.
TRY ONE
RESULT
SPX index5,000.00
ES future5,000.00
SPY ETF$500.00
1 ES contract value$250,000
Total exposure (1)$250,000
1 SPX pt = ES$50
1 SPX pt = SPY$0.10
1% index move50.00 pts
POSTABLE ARTIFACT

Trade this for real? Sutekka turns it into this →

Auto-pulled from your broker, rendered as a card you can drop into Discord, X, or your group chat. Free forever — no card.

Try the journal
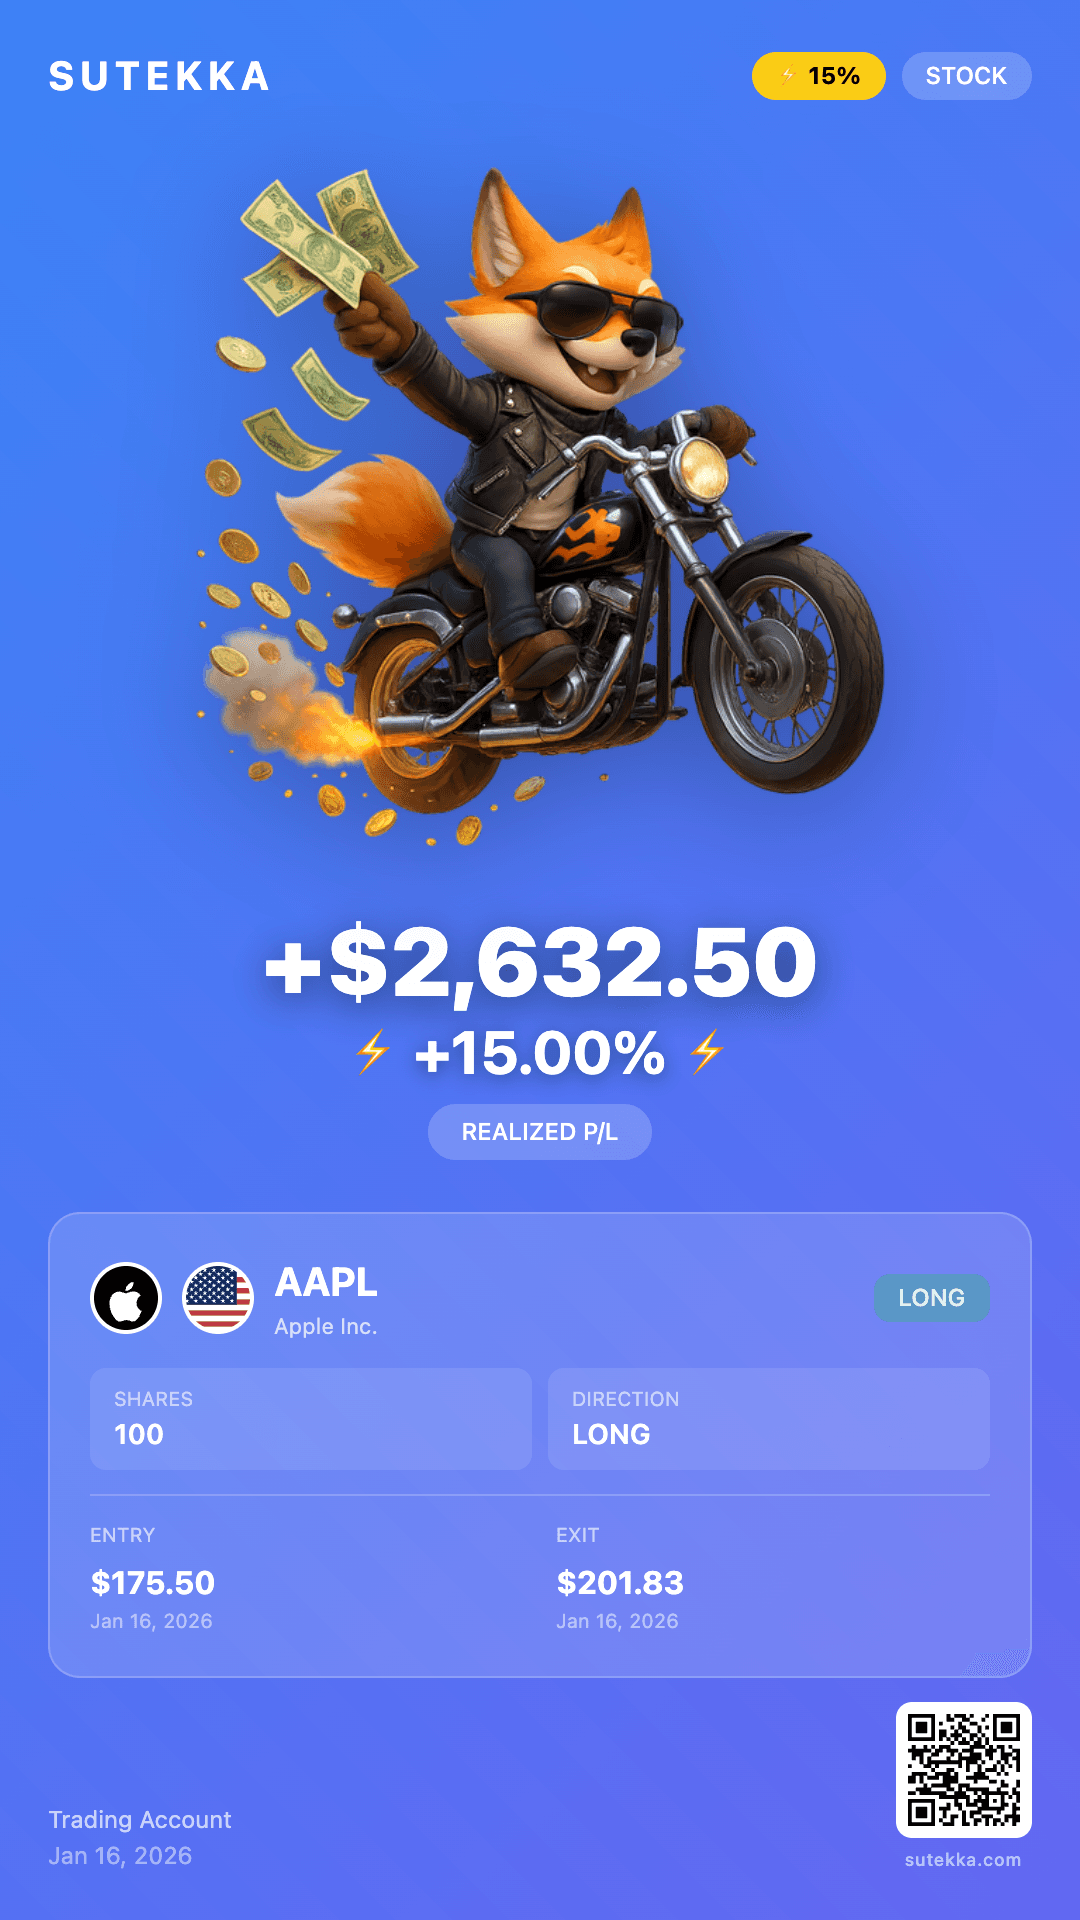
Sutekka trade sticker — AAPL long, +$2,632.50

ALSO USEFUL

HOW IT WORKS

Three ways to express the same exposure. SPX is the cash index — no direct trading. ES is the e-mini future at $50 per point, the futures community's standard. SPY is the ETF — about 1/10 of SPX but drifting slightly below that ratio over the year as SPY pays dividends and bleeds 0.0945% in expense ratio. The ratio you set drives the conversion both ways; default 0.10 is close enough for ballpark, but for tight work pull the actual ratio your broker shows. ES vs. SPX usually shows a small fair-value spread (carry minus dividends to expiry) but front-month is close enough that 1:1 works for sizing. One ES contract = $50 × SPX, so at SPX 5,000 a single contract carries about $250,000 of notional.

Three instruments, one index

SPX is the cash index itself — a calculation, not something you can hold. SPY is an ETF that owns the underlying basket, and ES is a futures contract priced off the index. All three track the same thing, which is why traders quote levels interchangeably, and none of them are the same instrument.

The conversions are ratios rather than identities. SPY trades near SPX ÷ 10 and ES trades near SPX itself, but "near" is doing real work in both cases. Keeping the ratio editable matters because the correct value drifts over the year rather than sitting at a constant.

A worked example

With SPX at 5,000 and the ratio at 10.0, SPY prints around $500. One ES contract at 5,000 carries 5,000 × $50 = $250,000 of notional — roughly the size of a house, controlled with a few thousand dollars of day margin.

The same exposure in SPY would be 500 shares at $500, or $250,000 of stock. That equivalence is the practical use of the converter: sizing a hedge in one instrument against a position held in another, without accidentally being off by a factor of ten.

Where this calculator misleads you

The three instruments do not trade in lockstep at the edges. ES runs nearly 24 hours while SPY is bound to the equity session, so overnight moves show up in ES first and gap into SPY at the open. A conversion computed at 3am describes where SPY should open, not where it last traded.

The SPY-to-SPX ratio is not a constant. Dividends paid out of the ETF and its expense ratio pull it below a clean 10 over time, then quarterly rebalancing nudges it back. Using a stale ratio introduces a small error that scales directly with position size.

Nothing here is a live quote. The tool computes relationships between prices you supply, which keeps it free and shareable but means the output is only as current as the numbers you type.

Terms on this page

SPX
The S&P 500 cash index. A calculated value — options settle on it, but it cannot itself be bought or sold.
ES
E-mini S&P 500 future, $50 per index point. Nearly 24-hour trading, quarterly expiry.
MES
Micro E-mini, one tenth of ES at $5 per point. The retail-sized version of the same exposure.
Fair value
The expected gap between a future and the cash index, driven by interest to expiry minus expected dividends.
Expense ratio
Annual fee taken from ETF assets. One of the two forces pulling SPY below a clean SPX ÷ 10.

FAQ

Why isn't SPY exactly SPX ÷ 10?

SPY is an ETF, not a derivative of the index. Its NAV is the value of its actual S&P 500 holdings divided by shares outstanding. Two things make the ratio drift below 10: dividends paid out by the ETF reduce NAV without reducing the index, and SPY's 0.0945% annual expense ratio is a slow leak. The ratio bounces around 9.95–10.05 over a year.

Why doesn't ES match SPX exactly?

ES is a futures contract priced off the index plus a fair-value spread: implied interest cost to expiry minus expected dividends. Front-month ES usually trades within a fraction of a percent of SPX, but it widens on quad-witching weeks and when rates or div expectations move.

How big is one ES contract?

ES is a $50-per-point future. At SPX 5,000 a single contract carries roughly $250,000 of notional — sized for institutional hedgers. MES (Micro E-mini) is 1/10 that size for retail.

Do you fetch live prices?

No. We compute relationships; you bring the prices. That keeps the tool free and the URL shareable. Type the current SPX (or SPY, or ES) and the other two fall out at the ratio you set.
NEXT

Done with the math?
Now log the trade.

Sutekka is the journal that tracks every trade you take. Free forever — no card.

Start logging — free